Developer Tools Dashboard
Comdeall provides a centralized developer dashboard to access key backend services for system observability, diagnostics, and documentation. This dashboard allows authorized users to seamlessly navigate between essential development and monitoring tools, providing comprehensive visibility into application performance, health, and operational status.
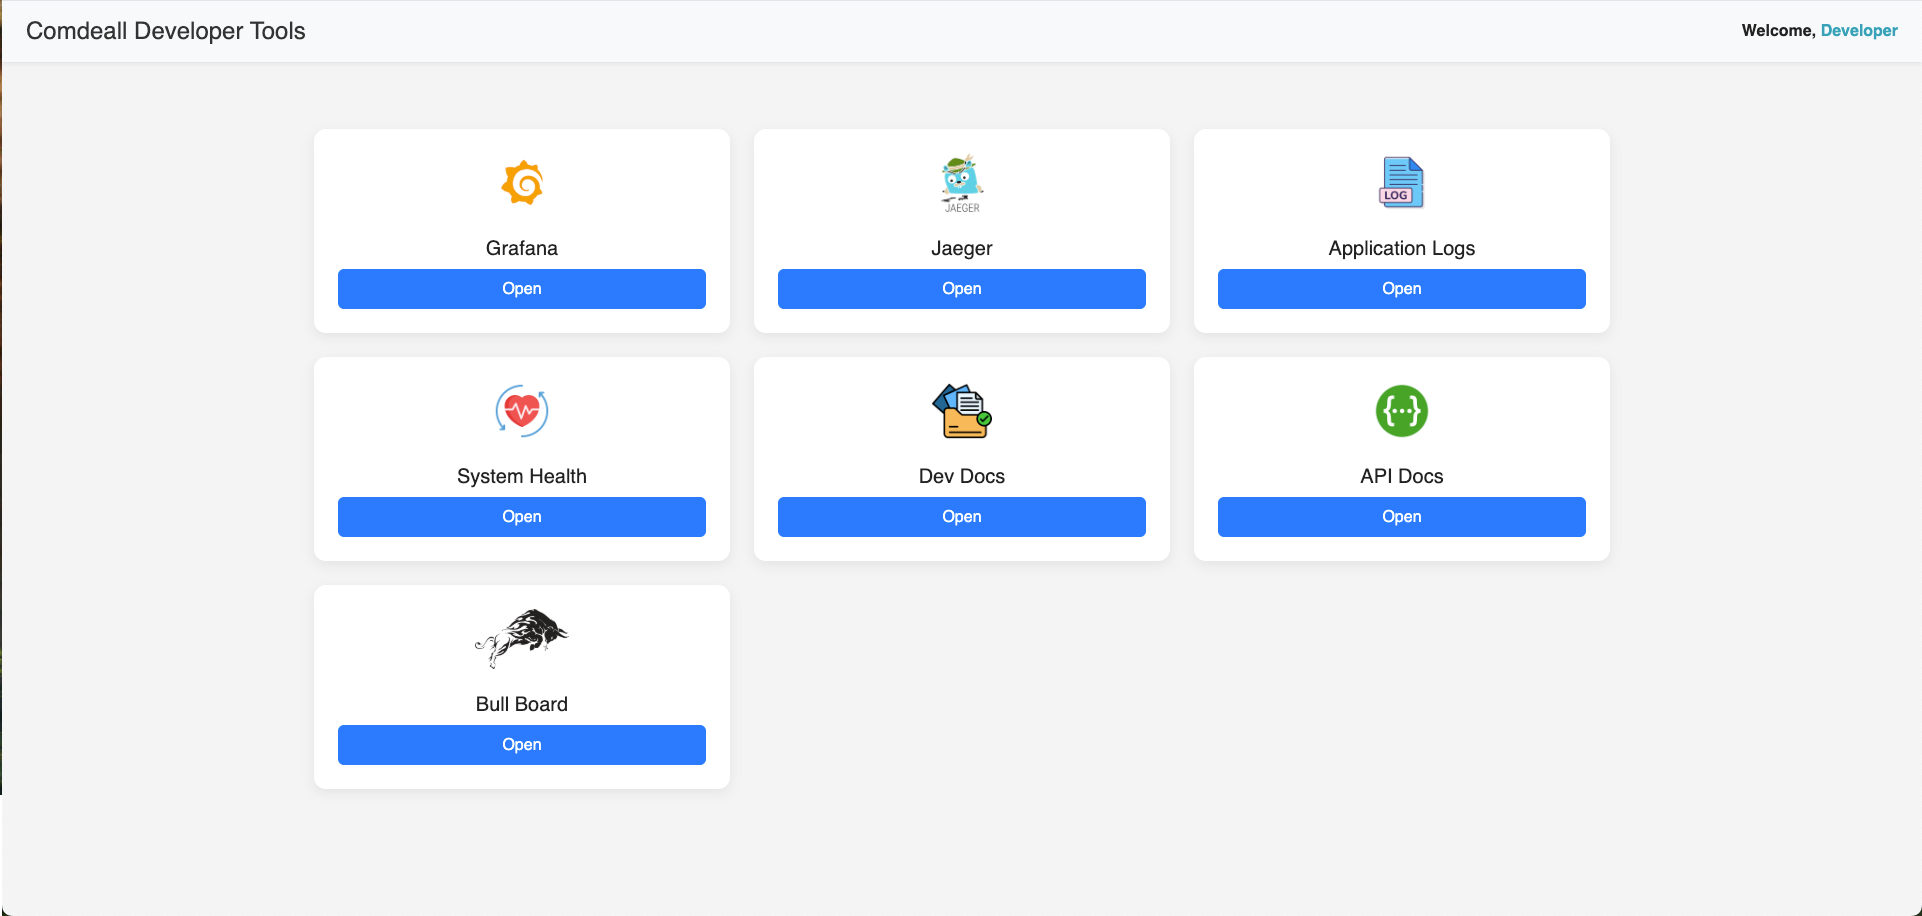
The dashboard provides unified access to:
- 📊 Grafana – Performance metrics, server monitoring, database performance, and application logs monitoring
- 🔍 Jaeger – Distributed tracing for request flow analysis and performance debugging
- 📋 Application Logs – Centralized log aggregation and real-time log monitoring
- ❤️ System Health – Real-time uptime monitoring and service heartbeat status
- 📘 Dev Docs – Developer-specific guides and API integration documentation
- 🧪 API Docs – Swagger-based interactive API explorer and testing interface
- 🧾 Bull Board – Queue inspection, retry, and debugging interface for background tasks
🔐 Access secured via configurable authentication with environment-specific URLs:
Table of Contents
- Module Overview
- Dashboard Architecture
- Core Features
- Individual Services
- User Interface
- Security Implementation
- Configuration Management
- Integration Points
- Technical Implementation
- Best Practices
- Conclusion
Module Overview
The Developer Tools module provides a unified interface for accessing critical development and monitoring services:
@Module({
  imports: [
    ServeStaticModule.forRoot({
      rootPath: join(__dirname, 'views'),
      renderPath: '/dev-tools',
    }),
  ],
  controllers: [DevToolsController],
  providers: [],
})
export class DevToolsModule {}
Core Components:
-
Controller Layer (
dev-tools.controller.ts): Handles dashboard rendering and tool configuration -
Template Engine (
views/dev-tools.pug): Responsive dashboard interface with Bootstrap styling -
Static Assets (
assets/): Tool icons and visual elements for intuitive navigation -
Configuration Management: Environment-specific URL configuration for different deployment stages
-
Security Layer: Configurable authentication and access control
Dashboard Architecture
Tool Configuration System
The dashboard dynamically configures tools based on environment settings:
@Controller(RouteNames.DEV_TOOLS)
export class DevToolsController {
  constructor(private readonly configService: ConfigService<EnvConfig>) {
    this.grafanaUrl = this.configService.get('GRAFANA_URL') || 'http://localhost:3001';
    this.appLogsUrl = this.configService.get('APP_LOGS_URL') || 'https://localhost:3000';
    this.devDocsUrl = this.configService.get('DEV_DOCS_URL') || 'https://localhost:3100';
    this.systemHealthUrl = this.configService.get('SERVICES_HEALTH_URL') || '/api/health/health-ui';
    this.jaegerUrl = this.configService.get('JAGER_URL') || 'http://localhost:16686';
    this.apiDocsUrl = `/${RouteNames.API_DOCS}`;
    this.bullBoardUrl = `/${RouteNames.QUEUES_UI}`;
  }
}
Configuration Features:
- Environment Awareness: Different URLs for development, staging, and production
- Fallback Support: Default localhost URLs for local development
- Dynamic Routing: Internal vs external service differentiation
- Extensible Design: Easy addition of new tools and services
Responsive Dashboard Interface
The dashboard provides an intuitive, card-based interface with modern styling:
Interface Features:
- Bootstrap Integration: Responsive design with mobile compatibility
- Card Layout: Clean, organized tool cards with hover effects
- Visual Icons: Distinctive icons for easy tool identification
- Tooltips: Enhanced user experience with helpful tooltips
- Professional Styling: Modern design with consistent branding
Core Features
Unified Access Portal
Single entry point for all development and monitoring tools:
Portal Benefits:
- Centralized Navigation: One dashboard for all essential tools
- Consistent Interface: Uniform design across different service types
- Quick Access: Direct links to external and internal services
- User Context: Developer identification and role-based access
- Responsive Design: Optimal viewing on desktop and mobile devices
Environment-Specific Configuration
Flexible configuration supports different deployment environments:
Configuration Management:
- Development: Local service URLs for development workflow
- Staging: Staging environment URLs for testing and validation
- Production: Production URLs with enhanced security measures
- Custom Overrides: Environment variable configuration for custom deployments
Tool Integration
Seamless integration with essential development and monitoring services:
Integration Features:
- Internal Services: Direct integration with application health and API documentation
- External Services: Configured links to Grafana, Jaeger, and log management systems
- Queue Monitoring: Integrated Bull Board for background job management
- Documentation Access: Direct links to developer documentation and guides
Individual Services
📊 Grafana - Performance Monitoring
Comprehensive application and infrastructure monitoring:
Monitoring Capabilities:
- System Metrics: CPU, memory, and disk utilization tracking
- Database Performance: PostgreSQL query statistics and performance analysis
- Application Metrics: Request/response times, throughput, and error rates
- Queue Analytics: Background job processing statistics and latency
- Custom Dashboards: Business-specific metrics and KPI tracking
Grafana Integration:
- Environment URLs: Staging and production Grafana instances
- Dashboard Links: Direct access to pre-configured monitoring dashboards
- Alert Integration: Real-time alerts and notification management
- Historical Analysis: Long-term trend analysis and capacity planning
🔍 Jaeger - Distributed Tracing
Advanced request tracing and performance analysis:
Tracing Features:
- Request Flow: End-to-end request tracing across microservices
- Performance Analysis: Detailed timing breakdown for optimization
- Error Tracking: Exception and error tracing for debugging
- Dependency Mapping: Service dependency visualization and analysis
- Bottleneck Identification: Performance bottleneck detection and resolution
📋 Application Logs - Log Management
Centralized logging and real-time log analysis:
Logging Capabilities:
- Real-time Monitoring: Live log streaming and filtering
- Log Aggregation: Centralized log collection from all services
- Search and Filter: Advanced log search and filtering capabilities
- Error Detection: Automatic error detection and alerting
- Log Analytics: Log pattern analysis and trend identification
❤️ System Health - Health Monitoring
Real-time system health and uptime monitoring:
Health Monitoring:
- Service Status: Live uptime checks for all critical services
- Health Endpoints: Comprehensive health check aggregation
- Dependency Status: External service dependency monitoring
- Performance Metrics: Real-time performance indicator tracking
- Alert Status: Health alert status and escalation management
Health Dashboard Features:
- Visual Status: Color-coded service status indicators
- Component Details: Individual service health with error information
- Historical Tracking: Health status history and trend analysis
- Mobile Responsive: Health monitoring accessible on mobile devices
📘 Dev Docs - Developer Documentation
Comprehensive developer resources and guides:
Documentation Features:
- API Integration: Complete API integration guides and examples
- Coding Standards: Internal coding conventions and best practices
- Architecture Guides: System architecture and design documentation
- Troubleshooting: Common issues and resolution procedures
- Onboarding: Developer onboarding and setup instructions
🧪 API Docs - Interactive API Explorer
Swagger-based API documentation and testing:
API Documentation:
- Interactive Testing: Live API endpoint testing and validation
- Request/Response: Complete request and response examples
- Authentication: API authentication and authorization documentation
- Schema Validation: Request and response schema documentation
- Code Examples: Client integration examples in multiple languages
🧾 Bull Board - Queue Management
Background job monitoring and management interface:
Queue Management:
- Job Status: Real-time job status and progress tracking
- Queue Statistics: Queue depth, processing rates, and performance metrics
- Job Retry: Manual job retry and requeue capabilities
- Error Analysis: Failed job analysis and debugging tools
- Dead Letter Queue: Failed job inspection and recovery options
Bull Board Features:
- Multi-Queue Support: Monitoring multiple job queues simultaneously
- Job Details: Detailed job information and execution logs
- Performance Metrics: Queue performance analysis and optimization
- Manual Intervention: Tools for manual job management and recovery
User Interface
Modern Dashboard Design
Professional, intuitive interface with enhanced user experience:
Design Elements:
- Card-Based Layout: Clean, organized tool presentation
- Hover Effects: Interactive elements with smooth transitions
- Professional Typography: Clear, readable font choices
- Consistent Spacing: Balanced layout with proper spacing
- Visual Hierarchy: Clear information hierarchy and navigation
Responsive Implementation
Mobile-first design ensures optimal viewing across devices:
Responsive Features:
- Mobile Compatibility: Optimized for smartphones and tablets
- Flexible Grid: Bootstrap grid system for responsive layout
- Touch-Friendly: Large touch targets for mobile interaction
- Adaptive Scaling: Content adapts to different screen sizes
- Cross-Browser: Consistent experience across different browsers
User Experience Enhancements
Enhanced interactivity and user guidance:
UX Features:
- Tooltips: Helpful information on hover for better guidance
- Visual Feedback: Clear indication of clickable elements
- Loading States: Appropriate loading indicators for external services
- Error Handling: Graceful handling of unavailable services
- Keyboard Navigation: Accessibility support for keyboard users
Security Implementation
Access Control
Configurable authentication ensures secure dashboard access:
Security Features:
- Authentication Options: JWT, session-based, or role-based authentication
- Authorization: Admin-only access with configurable permissions
- Rate Limiting: Protection against brute-force access attempts
- Session Management: Secure session handling and timeout policies
Security Configuration:
@Get()
@Auth(AuthType.NONE) // Configurable: can be JWT, ADMIN, etc.
showTools(@Res() res: Response) {
  // Dashboard rendering with security context
}
Environment Security
Different security policies for different environments:
Environment-Specific Security:
- Development: Relaxed security for development workflow
- Staging: Enhanced security with limited access
- Production: Maximum security with strict access controls
- Audit Logging: Complete access logging for security monitoring
Configuration Management
Environment Variables
Comprehensive configuration through environment variables:
Configuration Options:
// External service URLs
GRAFANA_URL=https://grafana.comdeall.com
APP_LOGS_URL=https://logs.comdeall.com
DEV_DOCS_URL=https://docs.comdeall.com
SERVICES_HEALTH_URL=/api/health/health-ui
JAGER_URL=https://jaeger.comdeall.com

// Authentication settings
DEV_TOOLS_AUTH_REQUIRED=true
DEV_TOOLS_ADMIN_ONLY=false
Dynamic Tool Registration
Extensible architecture supports easy addition of new tools:
Tool Registration:
const tools = [
  { name: 'Grafana', url: this.grafanaUrl, icon: 'grafana.png' },
  { name: 'Jaeger', url: this.jaegerUrl, icon: 'jaeger.png' },
  { name: 'Application Logs', url: this.appLogsUrl, icon: 'logs.png' },
  { name: 'System Health', url: this.systemHealthUrl, icon: 'health.png' },
  { name: 'Dev Docs', url: this.devDocsUrl, icon: 'docs.png' },
  { name: 'API Docs', url: this.apiDocsUrl, icon: 'swagger.png' },
  { name: 'Bull Board', url: this.bullBoardUrl, icon: 'bull.png' },
];
Integration Points
Application Integration
Seamless integration with main application architecture:
Integration Features:
- Route Configuration: Dedicated route namespace for dev tools
- Static Asset Serving: Efficient icon and asset delivery
- Template Rendering: Server-side template rendering with Pug
- Configuration Service: Integration with application configuration system
External Service Integration
Comprehensive integration with external monitoring and development tools:
External Integrations:
- Monitoring Systems: Grafana, Jaeger, and custom monitoring solutions
- Log Management: Centralized logging systems and log aggregation platforms
- Documentation: External documentation platforms and wikis
- Queue Management: Bull Board and custom queue monitoring solutions
Technical Implementation
Controller Architecture
Clean, configurable controller design:
Implementation Features:
- Configuration Injection: Environment-specific configuration management
- Template Rendering: Server-side rendering with dynamic data
- Error Handling: Graceful handling of configuration and rendering errors
- Performance Optimization: Efficient asset serving and caching
Template System
Modern template system with responsive design:
Template Features:
- Pug Integration: Clean, maintainable template syntax
- Bootstrap Styling: Professional, responsive UI components
- Dynamic Content: Server-side data injection and rendering
- Asset Management: Efficient static asset serving and optimization
Asset Management
Optimized asset delivery for enhanced performance:
Asset Features:
- Icon Library: Consistent iconography for all tools
- Caching Strategy: Efficient asset caching for improved performance
- CDN Integration: Bootstrap and external library CDN usage
- Optimization: Compressed assets for faster loading
Best Practices
Dashboard Design
Effective dashboard design principles:
Design Guidelines:
- Intuitive Layout: Logical tool organization and clear navigation
- Visual Consistency: Consistent styling and interaction patterns
- Performance Focus: Fast loading and responsive interactions
- Accessibility: WCAG compliance and keyboard navigation support
Security Practices
Comprehensive security implementation:
Security Guidelines:
- Authentication Strategy: Appropriate authentication for environment and usage
- Access Logging: Complete audit trail for dashboard access
- Secure Configuration: Environment-specific security configurations
- Regular Updates: Keep dependencies and security measures current
Maintenance and Monitoring
Ongoing maintenance and monitoring practices:
Maintenance Practices:
- Regular Testing: Ensure all tool links and integrations remain functional
- Performance Monitoring: Monitor dashboard performance and user experience
- Configuration Review: Regular review of tool configurations and URLs
- User Feedback: Gather developer feedback for continuous improvement
Conclusion
The Developer Tools Dashboard provides a comprehensive, centralized platform for accessing essential development and monitoring services in the Comdeall platform. Key strengths include:
Centralized Access:
- Unified Interface: Single dashboard for all essential development tools
- Environment Awareness: Appropriate tool configurations for different environments
- Responsive Design: Optimal viewing and interaction across all devices
- Professional Interface: Modern, intuitive design with enhanced user experience
Comprehensive Tool Integration:
- Monitoring Services: Complete integration with Grafana, Jaeger, and logging systems
- Development Tools: Direct access to API documentation and developer resources
- Queue Management: Integrated background job monitoring and management
- System Health: Real-time system health and uptime monitoring
Production-Ready Features:
- Security Implementation: Configurable authentication and access control
- Performance Optimization: Efficient asset serving and responsive design
- Extensible Architecture: Easy addition of new tools and services
- Configuration Management: Environment-specific configuration with fallback support
Operational Excellence:
- Developer Experience: Streamlined access to essential development tools
- Monitoring Integration: Comprehensive visibility into system performance and health
- Documentation Access: Direct links to API documentation and developer guides
- Maintenance Efficiency: Centralized tool management reduces complexity and improves productivity
The dashboard's architecture enables efficient development workflows, comprehensive system monitoring, and streamlined access to essential tools, making it an invaluable resource for developers, DevOps engineers, and system administrators working with the Comdeall platform.
🖼️ UI Preview
🛡️ Security
- Admin-configurable access with JWT/Session authentication options
- Environment-specific security policies and access controls
- Full CORS and CSP headers applied for enhanced security
- Rate limiting and brute-force protection capabilities
- Complete audit logging for access monitoring and compliance
🧩 Extensibility
- New services and dashboards can be easily added via configuration
- Tool cards auto-render based on registered service configuration
- Centralized design makes onboarding and monitoring streamlined
- Modular architecture supports custom tool integration
- Dynamic URL configuration supports various deployment scenarios
✅ Use this dashboard as a one-stop entry point for internal developers, DevOps engineers, and backend administrators to access all essential development and monitoring tools efficiently.